|
|
Wildland Development | Concepts | Wildland Development |
|
DIMENSIONS:
|
Map and Table References for Human Settlement
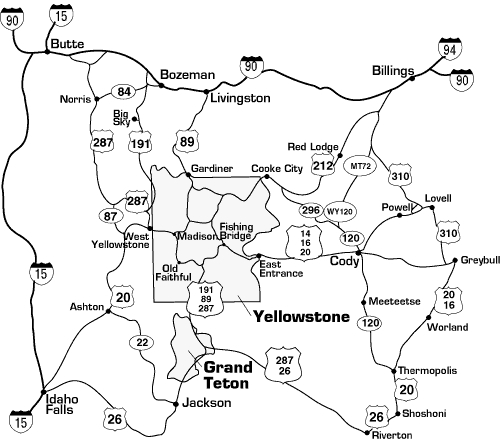
Map of Surrounding Gateway Communities to Yellowstone Source: http://www.yellowstonenationalpark.com
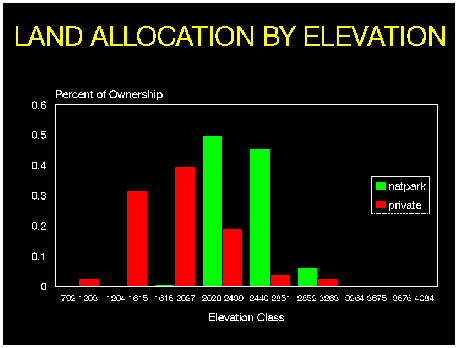
Table Showing the Differences in Land Holdings at differing elevations. Note: That land in lower elevations, such as river valleys are largely held by private landowners. Source: http://biology.usgs.gov/luhna/chap8.html
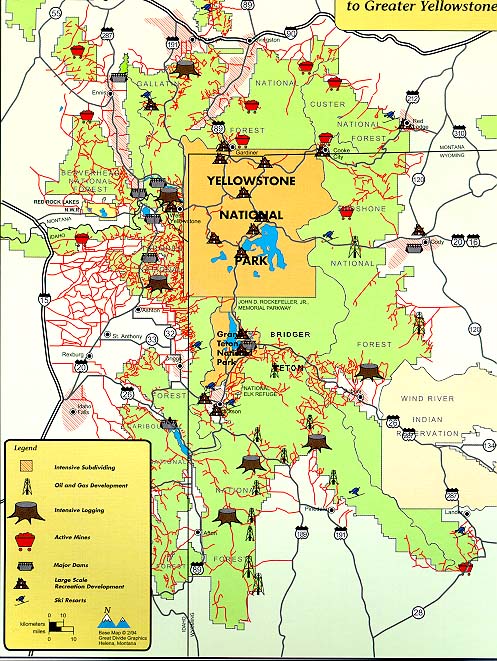
Map of Human Impacts on the Greater Yellowstone Ecosystem Source: Ralph Maughan http://www.forwolves.org/ralph/gyedevmap.htm
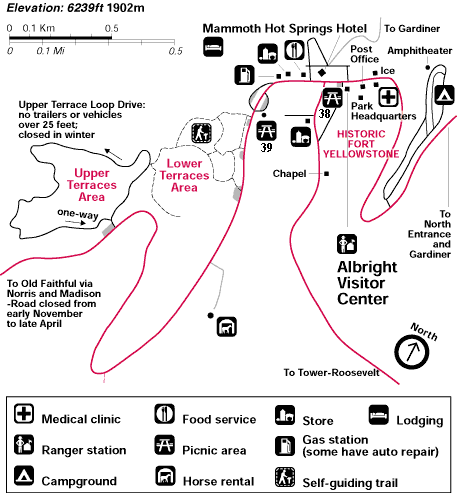
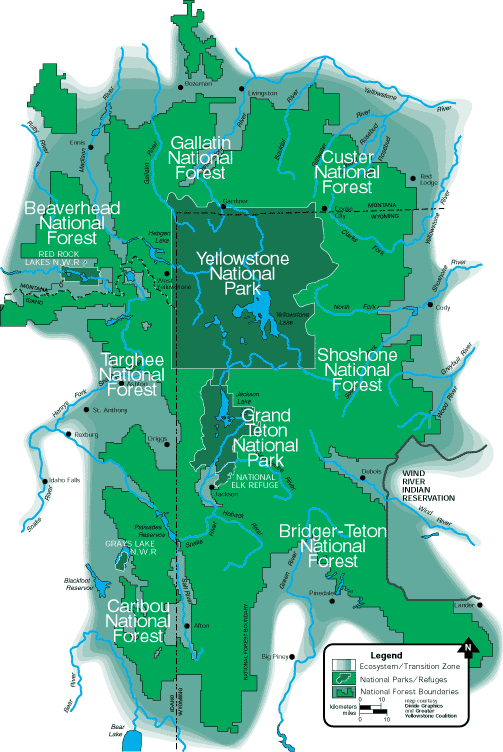
Recreation Map showing all the facilities provided for recreators in the Mammoth Hot Springs Section of Yellowstone. Source: http://www.nps.gov/yell/planvisit/orientation/mammoth.htm Map of The Greater Yellowstone Ecosystem Source: http://www.greateryellowstone.org
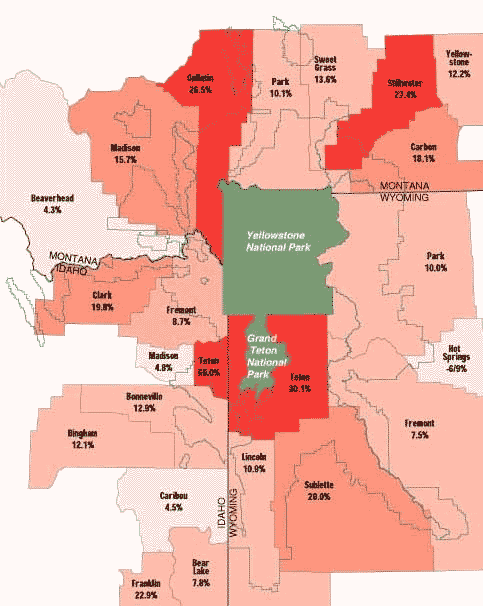
Map Showing the Population Growth Rates in Counties Surrounding Yellowstone Source: http://www.greateryellowstone.org/people_growth_ map.html
Map of Human Impacts in the GYE http://www.forwolves.org/Ralph/gyedevmap.htm
Available
Land for Lease Around Yellowstone National Park
|
|||||||||||||||||||||||||||||||||||||||||||
